Introduction
Currently, there are a few hundred IoT devices installed in UW buildings for monitoring energy consumption and various enviromental factors such as temperature and humidity. While UW has been using commercial software for data wareshousing and analysis, the software does not have the flexibility of customization to meet the growing need for different data engieering and analytics projects. This project is aimed at providing a proof-of-concept cloud solution for ingesting data from one IoT device and generating simple analytic results.
Methods
We first set up a SQL server on AWS and connected an IoT device in the Gowen Hall to the database. The device will send data to the database in real time. Next, we developed a Python-based API for querying and visualization. These steps will be discussed in greater detail as follows:
SQL Server
Given the scope of this project, we chose the db.t2.micro instance for our SQL server from AWS RDS to reduce the cost. The current rate for this type of instance is $0.9/day.
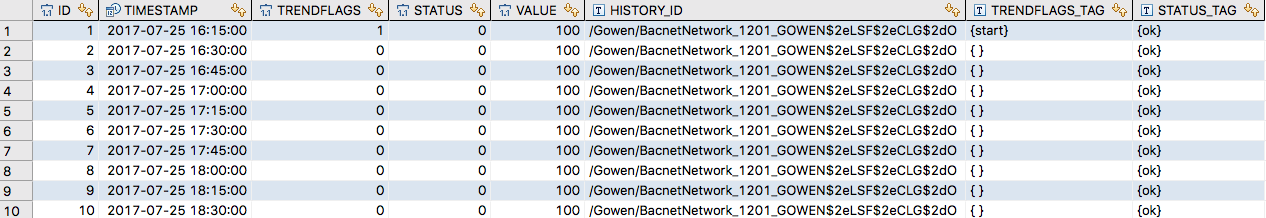
Within this server, we built a database named as ‘UWIOT’ and a table ‘HistoryNumericTrendRecord’. The IoT device will sync data into this table. A screenshot of the table can be seen from below.
API
The API was developed using Python 2.7. Package ‘pypyodbc’ and ‘Pandas’ were used for querying and analytics. Python code:
class TemperatureAPI():

    def __init__(self, db_host, db_name, db_user, db_passwd):
        '''
        Initialize parameters for connecting to MSSQL database at AWS.
        ---

        :type df_host: str
        :param df_host: url/IP of database host

        :type db_host: str
        :param db_name: name of database

        :type db_user: str
        :param db_user: user name

        :type db_passwd: str
        :param db_passwd: user password

        '''
        self.db_host = db_host
        self.db_name = db_name
        self.db_user = db_user
        self.db_passwd = db_passwd
        self.connection_string = 'Driver={ODBC Driver 13 for SQL Server};Server=' + db_host + ';Database=' + db_name + ';UID=' + db_user + ';PWD=' + db_password + ';'
        self.db, self.df, self.start, self.end = None, None, None, None

    def _buildConnecion(self):
        '''
        Establish connection to the remote MSSQL database at AWS RDS.
        '''
        try:
            self.db = pyodbc.connect(connectString = self.connection_string)
            print('connected successfully!')
        except:
            print sys.exc_info()

    def queryTemperature(self, start, end):
        '''
        Query temperature values from certain start and end date time.
        ---

        :type start, end: str
        :param start, end: e.g. 2017-08-10 07:00:00
        '''
        # establish database connection
        self._buildConnecion()

        query_str = "SELECT * FROM HistoryNumericTrendRecord WHERE HISTORY_ID LIKE '%/Gowen/BacnetNetwork_1201_GOWEN$2eLSF$2eMA$2dT%' AND TIMESTAMP BETWEEN "\
        + "\'" + start + "\'" + " AND " + "\'" + end + "\'" + ";";

        # query data with Pandas
        df = pd.read_sql(query_str, self.db)

        df.columns = ['ID', 'TIMESTAMP', 'TRENDFLAGS', 'STATUS', 'VALUE',
              'HISTORY_ID', 'TRENDFLAGS_TAG', 'STATUS_TAG']

        self.df = df
        self.start, self.end = start, end

    def linePlot(self):
        '''
        Calculate rolling mean for idicating increasing/decreasing trend;
        Generate line plot for illustrating temperature flucuations
        '''
        df = self.df

        # calculate rolling mean
        df['6hr'] = df['VALUE'].rolling(window = 24).mean()
        df['12hr'] = df['VALUE'].rolling(window = 48).mean()


        # plot temperature data and the corresponding rolling mean
        ax = df[['VALUE', '6hr', '12hr']].plot(figsize = (16, 5))

        title = 'Temperature Change Associated with \"LSF.MA-T\" from ' + self.start + ' to ' + self.end
        ax.set_title(title)

        # Set the x-axis label
        ax.set_xlabel("Minutes")

        # Set the y-axis label
        ax.set_ylabel("Temperature (deg F)")

        ax.legend(["T (15 min)", "T (6 hr)", "T (12 hr)"]);


    def saveQuery(self, file_path):
        '''
        Save query result as csv file to specified path.
        ---

        :type file_path: str
        :param: e.g. './file_to_save.csv'
        '''
        self.df.to_csv(file_path)
        print('qurey result has been saved to {}'.format(file_path))
how to use:
# connection configurations
db_host = 'SQL server URL'
db_name = 'UWIOT'
db_user = 'xxx'
db_password = 'xxx'
test = TemperatureAPI(db_host, db_name, db_user, db_password)
test.queryTemperature('2017-08-10 07:00:00', '2017-08-12 07:00:00')
test_df = test.df
test.saveQuery('./test.csv')
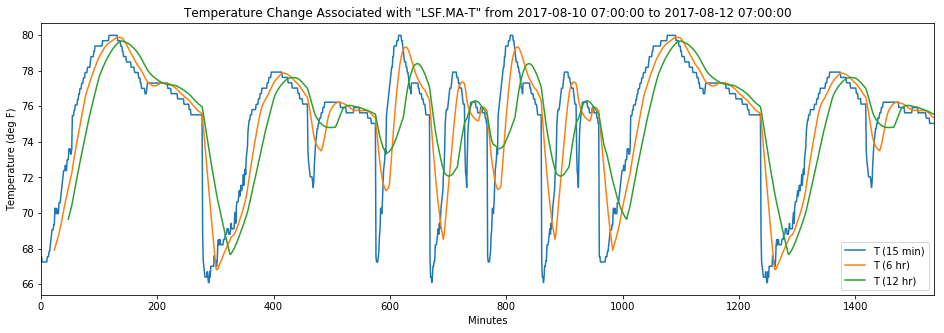
expected output plot:
Next Steps
The current SQL server has user name and password protection. To have a more secure SQL server, we could consider limiting the inbound IP connections and establishing a bastion server.